If you are starting your adventure in the digital world, it is essential to measure what happens on your website to better understand your visitors and optimize your results. Google Analytics is a free and powerful tool that allows you to know how users reach your page, what content interests them most and how they interact with your business.
In this article you will learn step by step how to set up Google Analytics from scratch and which are the key metrics you need to analyze to make the right decisions. Understanding this data will help you improve your online strategy, increase your conversions and, ultimately, grow your digital business efficiently. 
Index
- Step-by-step installation of Google Analytics on your website
- Key settings for accurate and relevant data
- Detailed understanding of essential Google Analytics metrics.
- How to interpret the most useful reports to optimize your website
- Practical tips for improving performance based on key metrics
- Frequently Asked Questions
- Conclusion
Step-by-step installation of Google Analytics on your website
To get started, go to the official Google Analytics website and sign in with your Google account. If you don’t have an account yet, create one quickly in a few steps. Once inside, follow these steps to install the tool on your website:
- Click on “Manage” and select “Create account”.
- Fill in the requested data: account name, website name, URL, sector and time zone.
- Accept the terms and conditions to obtain the tracking code.
Once you get the tracking code (a short JavaScript snippet), you will need to insert it into your website. If you use WordPress, you can install plugins such as Site Kit by Google or MonsterInsights that facilitate the installation without the need to modify code.
To verify that everything is working properly, log back into your Google Analytics account and check the “Real Time” section. Here you can check if your website is already sending data and registering the first visits. 
Key settings for accurate and relevant data
To make sure that Google Analytics records reliable information, you should pay attention to certain aspects during its initial setup. First, verify that you have demographic and interest tracking active, as this will allow you to better understand your audience. Also, enable the enhanced e-commerce feature if your business offers online sales, to accurately analyze the profitability of your products.
It is also essential to filter internal traffic, thus preventing your own visits from distorting the information collected. To do this, create a filter from the “Administrator” → “Filters” section and exclude your IP address. In addition, set up specific goals to monitor conversions according to key actions you want visitors to perform, such as:
- Newsletter subscriptions
- Free resource downloads
- Completion of the purchase process
Finally, be sure to link Google Analytics with other key tools, such as Google Search Console and Google Ads. This way, you will get a more complete and enriched view of user behavior on your website.
Detailed understanding of essential Google Analytics metrics.
Google Analytics provides you with key metrics that you need to master to measure and optimize your website’s performance. Among the most important are:
- Users: how many people visit your website.
- Sessions: total number of visits, including repeat visitors.
- Bounce rate: indicates the percentage of users who abandon your website after viewing only one page.
- Average session duration: how long users spend browsing your site.
- Page views: total number of pages visited on your website during a given period.
To better understand these metrics, here is an example of a table with fictitious data that you could find in your Google Analytics dashboard:
| Metric | Monthly value | Recommended target |
|---|---|---|
| Users | 5.200 | Increase 10% monthly |
| Bounce rate | 68% | Reduce to below 50%. |
| Average session duration | 1 min 45 sec | Exceed 3 min |
By analyzing these metrics you will be able to quickly detect the strengths and weaknesses of your website, identify which content attracts the most visitors and make informed decisions to improve your results.
How to interpret the most useful reports to optimize your website
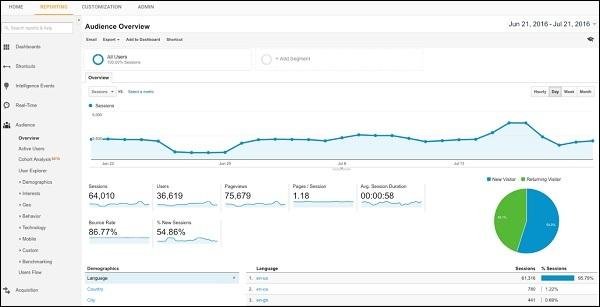
Once you have Google Analytics up and running, you will find that there are many reports available, but some are especially valuable for optimizing your website. The Audience report will allow you to know key details such as age, gender, location or interests of your visitors. With this data, you will be able to create content more aligned with their real preferences and needs.
The Acquisition report is also essential to understand where your users are coming from (search engines, social networks, email marketing, etc.). With this information you will know which channels work best and which should be promoted. To make it easier to read, focus on these key sections:
- Channels: discover the most effective traffic sources (organic, direct, referral, social).
- Source/Media: drill down to specific platforms (e.g., organic Google, Facebook Ads).
Finally, the Behavior report shows how visitors interact with your website (page views, average session duration, bounce rate). See which pages retain your users the longest and which ones lose visitors quickly. You can then make strategic decisions to improve your content, structure and user experience.
Practical tips for improving performance based on key metrics
To boost your online performance, focus on the metrics that really matter. First, set clear goals in Google Analytics to evaluate conversions, time on page or bounce rate. This way you will know exactly how your users are interacting with your content.
Optimize your analysis by regularly reviewing these key indicators:
- Bounce rate: Reduce this percentage by improving the loading speed and providing relevant content.
- Average time on page: Increase this value with engaging articles, videos or infographics.
- Conversion rate: Improve this metric by optimizing your calls to action and simplifying the purchase or registration process.
In addition, to facilitate your tracking, you can create a customized dashboard in Google Analytics. Choose only those metrics that make a difference to your business and review them weekly for immediate improvement opportunities.
Frequently Asked Questions
What is Google Analytics and what exactly is it for?
Google Analytics is a free tool provided by Google that allows you to analyze and measure your website traffic. Thanks to it, you can know how users interact with your page, where they come from, what contents arouse more interest and what aspects you could improve to optimize your online presence.
How can I set up Google Analytics on my website?
To set it up, you must first create a free account at analytics.google.com. Then, you will have to register your website, thus obtaining a tracking code that you will have to insert in all the pages of your site. You can do this by copying the code directly into the HTML header of the site or by using specific plugins if you use platforms such as WordPress, Joomla or other similar ones.
How long does it take Google Analytics to start recording data?
Once the code is installed, Google Analytics will start collecting information immediately. However, it is advisable to wait 24 to 48 hours to be able to observe complete and reliable statistics on user behavior.
What are the key metrics you should review regularly?
There are several key metrics that will help you evaluate the performance of your website. Among the most important are: number of unique users, total sessions or visits, bounce rate, average session duration, pages viewed per session, traffic sources, most visited pages and conversions or goal achievement.
What exactly does the bounce rate mean and why is it important?
Bounce rate is the percentage of users who arrive at a page on your website and leave it without interacting or visiting other pages. A high bounce rate may indicate that your content does not meet the user’s expectations or that the page is not properly optimized. Therefore, it is important to monitor this metric to improve your content and user experience.
How can I use Google Analytics to improve the performance of my website?
Thanks to the data provided by Google Analytics, you will be able to identify which content generates the most interest, which pages have the highest abandonment rates and which are the most important sources of traffic. With this information, you can make informed decisions, optimize your content to increase interaction and improve the overall experience of your visitors.
Do I need advanced technical skills to use Google Analytics?
Not necessarily. Although some advanced features require more in-depth knowledge, most key metrics are easily accessible and understandable for any user. In addition, Google offers free documentation and tutorials to help you familiarize yourself with the tool and get the most out of it.
Conclusion
Now that you know how to set up Google Analytics and understand its main metrics, it’s time to put this knowledge into practice and start optimizing your online business. Remember that measuring and analyzing your web traffic is key to make strategic decisions that bring you closer to your goals.
Don’t forget to periodically review your reports and adjust your actions based on the data obtained. With consistency and attention to these details, you will be closer to turning your digital project into a solid and sustainable source of income.
Do you have a question or experience to share about Google Analytics? Leave me a comment below and I’ll be happy to help you on your way to digital success.